Franklin and Folger Gulf Stream chart. |
|
|
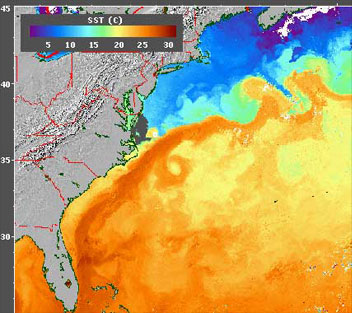
Benjamin Franklin (1706-1790) served as the United States colonial deputy postmaster general from 1753 to 1774. He found that British merchant ships arriving in the colonies from England took many days to weeks longer to make the voyage than American vessels. The lord of the treasury in Great Britain asked Franklin for an explanation. Franklin consulted with his cousin, Timothy Folger, a Nantucket, MA whaling ship captain, who told him about the Gulf Stream, the strongest surface current in the North Atlantic (often 10 to 12 km per hr or 6 to 7 mi per hr-roughly the speed of a modern sailing ship). On east bound voyages, American captains sailed with the current but on the return voyage they would avoid it, cutting up to weeks off the journey. At the time, British captains were unaware of the Gulf Stream. Franklin published his cousin's chart showing the location of the Gulf Stream and presented it to the British. The location of the Gulf Stream plotted on the 1769 Franklin-Folger map shown on the left, is remarkably similar to the location of the Gulf Stream as revealed by satellite-derived sea-surface temperature (SST) patterns below. British authorities refused to take advantage of or acknowledge the Franklin-Folger map. Franklin took measurements of sea-surface temperatures during his crossings of the Atlantic, thereby developing a navigation technique based on the location of the warm Gulf Stream waters.
|